Getting Started Using Britecharts
We created Britecharts to help users consume and create D3.js charts. It leverages the Reusable API, a code pattern to encapsulate D3.js charts. This pattern produces chart objects that can be configured, reused and composed to build data visualizations.
In this tutorial, we will create a simple data visualization using Britecharts. You will learn how to load Britecharts, instantiate and configure a chart and plot it within a container with a data set.
Downloading Britecharts
To use a Britechart, we need to install the library. In this tutorial, we are going to use a simple CDN link to install it. For that, create a simple HTML file and add these script tags:
<script src="https://cdnjs.cloudflare.com/ajax/libs/d3-selection/1.2.0/d3-selection.js"></script>
<script src="https://cdn.jsdelivr.net/npm/**@britecharts/core@3.0.0/dist/umd/bar.min.js"
        type="text/javascript"></script>
We are going to create a bar chart, so we download the bundle for that individual chart. Note that we also require d3-selection. We use this module to create a selection and load the data in the container where we render the chart.
We also need to load the styling of our chart, and we do it similarly by accesing the CDN link:
<link rel="stylesheet" href="https://cdn.jsdelivr.net/npm/@britecharts/core/dist/css/britecharts.min.css" type="text/css" />
Setting up Container, Dataset and Chart
To create a container, first we need to add a div in the DOM with a class:
<div class="bar-container"></div>
Next, we can create our D3.js container using the d3-selection module:
const container = d3.select('.bar-container');
We instantiate a new chart by calling the function bar() inside the britecharts object in the global namespace:
const barChart = britecharts.bar();
We need a simple dataset to render the bar chart. We can find the right format of the data by visiting the API documentation for the bar chart component. Developers need to find the data definition at the top of the page; in this case, it is a link labeled BarChartData. It looks like this:
[
    {
        value: 1,
        name: 'glittering'
    },
    {
        value: 1,
        name: 'luminous'
    }
]
We can extend that definition to have some more bars, for example:
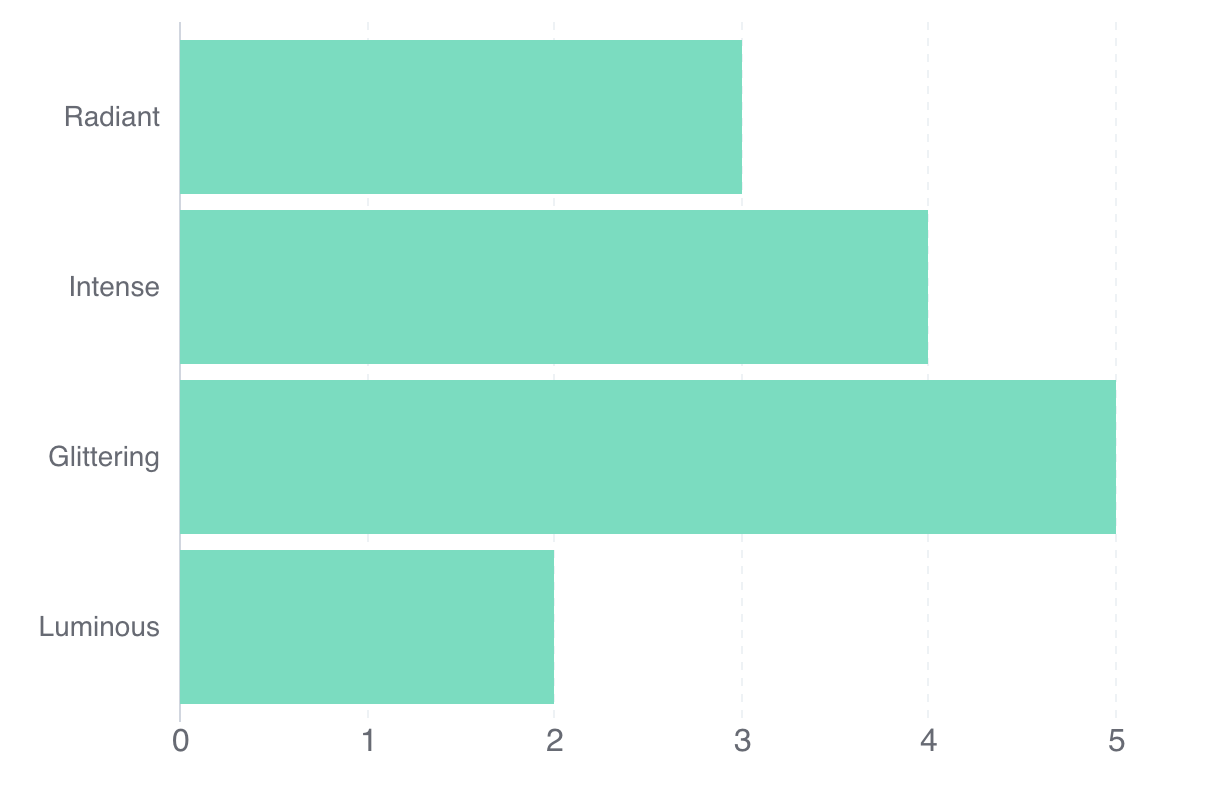
const barData = [
    { name: 'Luminous', value: 2 },
    { name: 'Glittering', value: 5 },
    { name: 'Intense', value: 4 },
    { name: 'Radiant', value: 3 }
];
Configuring and Rendering the bar chart
We only need to configure our bar chart by calling the accessors. We describe these in the bar chart API reference page. In this tutorial, we set it up as a horizontal bar chart with a height of 400px and a width of 600px:
barChart
    .margin({left: 100})
    .isHorizontal(true)
    .height(400)
    .width(600);
Notice how we tweaked a bit the left margin in order to allow space for our left aligned labels to render.
We only need to combine our configured bar chart with the container and the data to render our chart:
container.datum(barData).call(barChart);
To render a simple bar chart:
Here is all the code inside the <body> tag of our HTML file:
<div class="bar-container"></div>

<script>
    // Instantiate bar chart and container
    const barChart = britecharts.bar();
    const container = d3.select('.bar-container');

    // Create Dataset with proper shape
    const barData = [
        { name: 'Luminous', value: 2 },
        { name: 'Glittering', value: 5 },
        { name: 'Intense', value: 4 },
        { name: 'Radiant', value: 3 }
    ];

    // Configure chart
    barChart
        .margin({left: 100})
        .isHorizontal(true)
        .height(400)
        .width(600);

    container.datum(barData).call(barChart);
</script>
In version 3 of Britecharts, the rendered charts are already responsive, so you can stretch and compress the viewport size to see the chart react.
You can check the full code of this tutorial in this file and the tutorial working here.
Summary
In this tutorial, we have seen how to load Britecharts with a CDN link and how to draw a simple chart. We did this by checking the API Reference page for the chart and its data schema and by creating the elements needed in the HTML file.
To keep on learning more about Britecharts, you can follow our Composing Your First Data Visualization tutorial or read abbout how to install Britecharts in your project. You can also check out our Documentation Homepage and our kitchen sink to see all the available charts.
If you are excited about Britecharts, want to add more configurable properties or even create your own chart, please check our Contributing Guide. In it, we walk you through the development environment setup, running our docs and demos and creating new Pull Requests.