Britecharts 3.0 beta 8, accessible by default

Britecharts 3.0.0-beta.8 is out! Every chart in it can be read by a screen reader cell by cell, used with a keyboard, themed with CSS and drawn in dark mode, with no setup. It is also the first version built for coding agents as well as for people.
npm install @britecharts/core@beta
Why there is another beta
I wrote that beta 7 would be the last beta, and that only bug fixes would come before 3.0.0. That did not happen. I compared Britecharts with eight current charting libraries, and the comparison showed what Britecharts can do better than any of them: finished charts that are accessible by default, free, and easy for an agent to write. Most of that work changes the API, so it had to land before 3.0.0 fixes the API in place.
Accessible by default
Only one library in that comparison gave readers a data table, keyboard navigation and reduced motion together, and it charges per seat. Every Britecharts chart now does all of it, with each part on by default and each one possible to turn off. See how to make a chart accessible.
- Its data as a table. Every chart but the legend renders its data as a visually hidden table after its svg, so a screen reader can read it cell by cell. Series charts lay it out with a row per date or name and a column per series. Turn it off with
a11yDataTable(false). - A keyboard can move through the data. The bar, donut, grouped bar, heatmap, line, scatter plot, stacked area and stacked bar charts are each one tab stop. The arrow keys move between points, Home and End go to the ends, and Escape lets go. The point is highlighted and the tooltip follows focus, as they do for a pointer. Turn it off with
a11yKeyboardNavigation(false). - Still when the reader asks. With
prefers-reduced-motion, the charts draw without animation whateverisAnimatedsays, and the tooltip and legend stop fading. - A colour-blind-safe palette.
colors.colorSchemas.okabeItokeeps its eight colours apart with the common kinds of colour blindness.
Themes and dark mode, with CSS
Every colour around the data is now a --bc-* custom property: text, axes, grid, tooltips, legend and loading states. The charts follow your page's color-scheme through light-dark(), so color-scheme: light dark on your page is all dark mode needs. To change one colour, set its token, such as .britechart { --bc-text-muted: #555 }. A page that declares no colour scheme stays light. See how to theme a chart.
Made for coding agents
An agent writes a chart correctly more often when the library tells it what it needs. This beta adds four ways to do that:
- An agent skill ships in
@britecharts/core, with each chart's data shape, accessors, events and the v2 code that no longer works. Install it withnpx skills add britecharts/britecharts. - A JSON Schema for every chart's spec,
{ chart, config, data }, generated from the TypeScript types and published athttps://britecharts.github.io/britecharts/schema/v3/<chart>.json. An editor or an agent can check a spec before drawing it. See how to describe a chart as a spec. - Errors that say how to fix them. A misspelt key gets
heigth: did you mean height?and a link to the chart's API page. A value of the wrong type names the type it should be. - llms.txt describes every chart and accessor, generated from the same comments as the API pages.
New in the charts
- 100% stacks.
isNormalized(true)stretches every stack of the stacked bar, or every date of the stacked area, to fill the value axis, which then reads from 0% to 100%. - Any categories in the heatmap.
xAxisLabelsjoinsyAxisLabels, so a heatmap can compare any two sets of categories, such as a square grid of six. - SVG export.
exportChart('chart.svg')downloads an svg with its styles inlined, so it looks the same outside the page and stays sharp at any size. - Every chart in every package. The brush and the heatmap now have a wrapper and a React component, like the other charts.
- Fixes you may have hit. The brush no longer flickers on a second selection or fires
customBrushEndwhile idle. The animated stacked bar grows each stack as one block. The legend's highlight commands no longer throw before it draws. A bullet can have more than one marker. - Smaller app bundles. Each package declares
sideEffects, so bundlers can drop the charts an app does not import. In a bar-only test app, the bundle went from 104.0 kB to 89.6 kB.
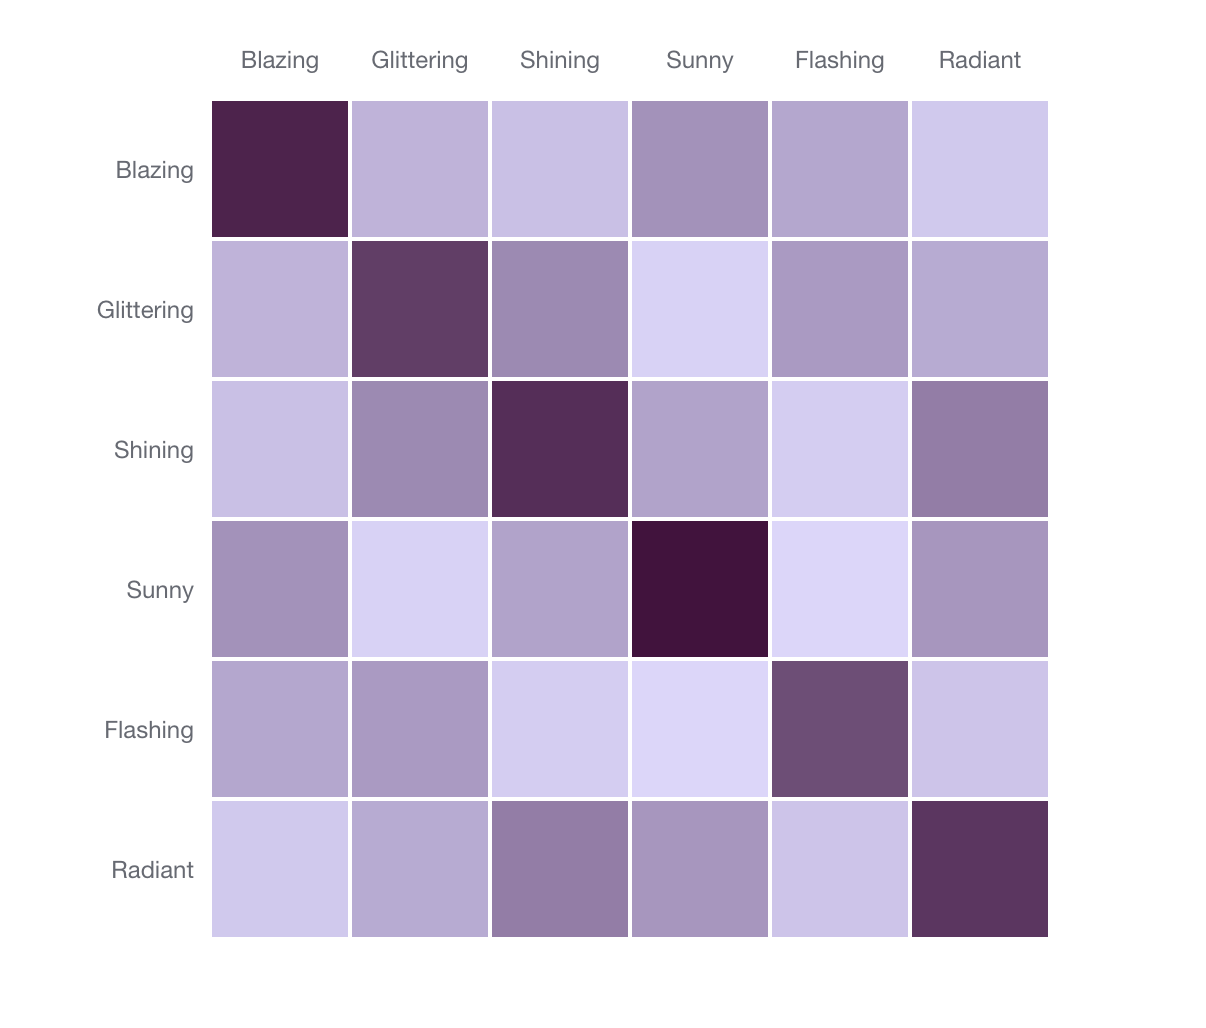
The Storybook shows all of it, with the same stories under the same names in core and in React.
What to check before you upgrade
Five changes in this beta can affect a page that works with beta 7:
- Charts add a tab stop and a hidden table. If your page has its own table of the same data, or a tab order to keep, turn them off with
a11yDataTable(false)ora11yKeyboardNavigation(false). - The wrappers check value types.
createandupdatethrow on a value of the wrong type, such asheight: "300". Before, the string reached the chart. - An exported title gets its own band. The title sits in a 30px band above the chart instead of over its top edge, so an exported image with a title is 30px taller.
- The heatmap's label classes changed.
.day-labelis now.row-label,.hour-labelis.column-label, and their groups are.row-labels-groupand.column-labels-group. The row labels now end at the grid, and both axes share one label style. - Some colours are set as styles now. The tooltip's text, the donut's empty slice, the scatter plot's hollow circles, the line chart's custom lines, the sparkline's gradient and the heatmap's labels take their colours from the
--bc-*tokens, set on the element. A CSS rule on those elements no longer wins, so set the token instead.
If you are coming from version 2, the migration guide has the full list.
What happens next
The API work I wanted before 3.0.0 is done, so this time I mean it: what follows is bug fixes, then 3.0.0. Bigger features, such as server-side rendering, a Canvas renderer or Web Component bindings, wait as issues that need votes. Add a 👍 to the ones you would use.
Please try this beta in a real project, with a screen reader and a keyboard if you can. Open an issue with the chart, the data and what you expected.
Britecharts still needs maintainers. If you would like to own part of it, the contributing guide is where to start.